Digital Emissions — Research Initiative
National AI Data Center
Database
The first publicly accessible, integrated U.S. database tracking existing and planned AI data centers across three ecological dimensions: energy consumption, water usage, and carbon emissions. Free, transparent, and citable.
About the Project
Why NDCDB?
Every comparable tool today — DC Byte, Structure Research, Omdia, SemiAnalysis, S&P 451, Baxtel — is commercial and paywalled, and most omit the environmental layer entirely. NDCDB fills that gap as a free, transparent, citable resource for researchers, journalists, and ESG teams.
Open & Citable Data
A free, public alternative to paywalled commercial trackers — purpose-built for peer-reviewed research, investigative journalism, and enterprise ESG benchmarking.
United States — Phase I
Coverage begins with U.S. AI data centers across all four facility tiers, with a star-schema data model built for future multi-country expansion.
Energy · Water · Carbon
Three ecological dimensions tracked per facility: power capacity and consumption, water withdrawal and consumption, and direct/indirect GHG emissions (Phase II).
Provenance-First
Every data point carries a source key, estimation method, and confidence score (1–10). The research pipeline is a deliverable, not just the data.
NLP & ML Augmentation
AI responsibly applied as a tooling layer: NER on permit portals and industry news, ML for de-duplication, and geospatial correlation — while studying AI's own environmental footprint.
Three Target Users
Academic researchers needing citable data, investigative journalists on deadline, and ESG/enterprise teams benchmarking supply-chain sustainability.
Strategic Context
The Problem Space
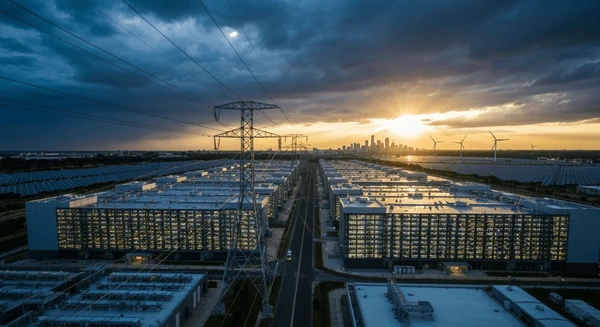
AI data centers are among the fastest-growing sources of industrial energy demand and freshwater consumption in the United States. The buildout is happening at a speed that outpaces public-sector reporting and academic tracking alike.
Northern Virginia alone already hosts 4,575 MW of data center capacity. Phoenix is projected to reach 5,340 MW — a 554% increase. Las Vegas / Reno: 953% projected growth. These are not incremental changes; they are infrastructure transformations with lasting ecological consequence.
Eight-Phase Roadmap
Execution Plan
Each phase has a discrete deliverable, acceptance criteria, and an assigned researcher. The GateKeeper reviews all integration decisions before data enters the conformed layer.
Lock the AI Classification Framework
Finalize AI Tier methodology v0.1 (versioned, with edge-case rules). Three test classifications run against real facilities; rules produce expected tier without ambiguity. PI sign-off required.
Drafted — Awaiting PI Sign-offBuild the Spine — FracTracker Ingestion
Ingest FracTracker (153 records) → normalize addresses (geocoding) → mint Campus IDs (≤500m centroid + operator canonicalized) → apply tier classification → populate DIM_CAMPUS, DIM_FACILITY, DIM_ENTITY, FACT_FIELD_LINEAGE.
In Progress — Ryan ForsytheLayer in Confirmed-AI Sources
EpochAI Frontier DCs → Cornell AI DC Locations → Hyperscaler official location pages. Fuzzy-match against spine; enrich existing campuses or mint new ones; log tier promotions from Tier 2/3 → Tier 1. Target: ≥90% of Tier 1 records at confidence score ≥6.
Not Started — Nathan & JacobCoverage Audit
BusinessInsider → S&P Global 451 → Map.Datacente.rs U.S. subset as left-anti-joins. Attempt campus match; flag unmatched as coverage gaps. Target: ≥70% U.S. AI data center coverage. Publish coverage report.
Not Started — Jacob & GateKeeperEstimate Power Capacity & Consumption
Tiered fallback: direct_disclosure → permit_derived → modeled_from_size → state_avg_fallback. Target: ≥95% of Tier 1–3 records with power_capacity_mw populated and method field non-null.
Methodology Draft NeededEstimate Water Consumption
Cooling-aware tiered fallback: direct_disclosure → cooling_aware_modeled (classify cooling type, apply WUE) → state_avg_fallback → unknown. Target: ≥80% of Tier 1–3 records populated.
Methodology Draft NeededCompute Confidence Scores
Implement score function reading FACT_FIELD_LINEAGE → write confidence_score per record. Inspect distribution histogram; tune weights; flag low scores (≤4) to review queue.
Not Started — GateKeeper & Research EngineerExternal Calibration
Sum power_capacity_mw × utilization → project annual MWh → compare to LBNL national estimate. Repeat for water. Publish calibration report. Acceptance: totals within ±25% of benchmark. Becomes recurring quarterly benchmark post-launch.
Not Started — PIResearch Design
Methodology
All methodology documents are versioned. The classification framework, estimation methods, and confidence-score function are each a discrete deliverable with explicit acceptance criteria.
AI Classification Framework v0.1
Highest Confidence
AI-pure-play operator (xAI, CoreWeave, Crusoe, Lambda Labs), confirmed AI tenant publicly disclosed, publicly named AI initiative (Colossus, Stargate, Rainier), or hyperscaler with explicit AI training/inference disclosure and benchmarked GPU capacity.
High Confidence
Hyperscaler or major colocation with disclosed hyperscaler tenants, commission date 2022 or later (empirical AI-GPU inflection point), or power capacity ≥50 MW. Targeted for promotion to Tier 1 as information emerges.
Medium Confidence
Hyperscaler-operated but pre-2022 or <50 MW. Likely hosting some AI workload as operators retrofit. Required fields populated; Desired fields where easily available.
Excluded from Default Views
Pure colocation, enterprise, or edge data centers with no AI tenant signal. Lowest augmentation priority; not surfaced in default public-facing views. Address normalization only.
Power Estimation — Tiered Fallback
direct_disclosure
Operator, EpochAI, S&P 451, or FracTracker reported value. Highest confidence.
permit_derived
Air-permit-derived MWh/yr range from backup generator permit filings.
modeled_from_size
Facility sqft × industry-standard W/sqft × State PUE from Cornell PEESEgroup.
state_avg_fallback
Operator-tier average power within state. Lowest confidence — always flagged.
Water Estimation — Cooling-Aware Fallback
direct_disclosure
Google/Meta environmental reports, EpochAI, FracTracker water fields.
cooling_aware_modeled
Classify cooling type (evaporative, closed-loop, air-cooled, hybrid); apply WUE per type via FracTracker or climate-zone inference.
state_avg_fallback
Cornell PEESEgroup state-level WUE × estimated annual power consumption.
unknown
Field flagged and left unpopulated. Water disclosure is sparser than power.
Confidence Score Function
Data Provenance
Source Registry
25 sources scouted to date. Each source carries a credibility tier (1=primary, 2=academic, 3=journalism, 4=industry, 5=aggregator), a paywall flag, and a pipeline status. Staged sources have been ingested into the raw data layer.
| Source | Organization | Records | Type | Credibility | Status |
|---|---|---|---|---|---|
| FracTracker National DC Tracker | FracTracker Alliance | 153 | Dataset | Primary | Staged |
| S&P Global / 451 Research | S&P Global | 466 | Dataset | Industry | Staged |
| EpochAI Frontier Data Centers | Epoch AI | 23 | Dataset | Academic | Staged |
| Cornell AI DC Locations | Cornell University | 387 | Dataset | Academic | Staged |
| Cornell PEESEgroup PUE/WUE | Cornell University | 49 states | Academic | Academic | Staged |
| BusinessInsider Air Permits | Business Insider | 1,242 | Journalism | Journalism | Staged |
| Map.Datacente.rs (U.S. subset) | Datacente.rs | 6,331 (global) | Aggregator | Industry | Staged |
| Google 2025 Environmental Report | Google / Alphabet | 94 locations | Disclosure | Primary | Staged |
| Meta 2025 Environmental Data Index | Meta | Per-location metrics | Disclosure | Primary | Staged |
| Microsoft 2025 Environmental Fact Sheet | Microsoft | Per-location metrics | Disclosure | Primary | Staged |
| EpochAI Water Dataset (chillers, timelines) | Epoch AI | Multi-table | Dataset | Academic | Staged |
| EPA ECHO Facility List + GIS | U.S. EPA | GIS reference | Government | Primary | Staged |
| EIA Energy Consumption Tables | U.S. EIA | State-level | Government | Primary | Staged |
| Google / Microsoft / Meta location pages | Hyperscalers | TBD | Disclosure | Primary | Under Review |
| Omdia Data Center Tracker | Omdia | TBD | Dataset | Industry | Under Review |
| SemiAnalysis | SemiAnalysis | TBD | Industry Report | Industry | Under Review |
| Baxtel | Baxtel | TBD | Aggregator | Industry | Parked |
| Stanford AI Index 2026 | Stanford HAI | Reference | Academic | Academic | Parked |
| SightLine / Upwind | Various | TBD | Industry | Industry | Parked |
| DataCenterMap / DataCenters.com | Various | TBD | Aggregator | Industry | Parked |
Coverage & Scale
Data & Metrics
Current dataset summary as of May 2026. All figures are pre-integration — conformed totals will be published after Phase 3 (Coverage Audit) completes.
Notable Tier 1 Facilities (EpochAI Sample)
| Facility / Initiative | Operator | Location | Power (MW) | H100e Equivalent | Capex |
|---|---|---|---|---|---|
| Project Rainier | Amazon (Anthropic) | New Carlisle, IN | 751 | 471,565 | $23.97B |
| Meta Prometheus | Meta | New Albany, OH | 691 | 502,625 | — |
| Microsoft Fairwater | Microsoft | Georgia | 615 | 531,161 | — |
| Google New Albany | New Albany, OH | 543 | 235,426 | — | |
| xAI Colossus 1 | xAI | Memphis, TN | 498 | 275,796 | — |
| xAI Colossus 2 | xAI | Memphis, TN | 351 | 353,508 | — |
| OpenAI-Oracle Stargate | Oracle / OpenAI | Abilene, TX | 295 | 254,674 | — |
| Google Pryor | Pryor, OK | 195 | 62,851 | — |
Regional Capacity — Current vs. Projected (MW)
Schema Design
Data Model v0.2
A star schema centered on FACT_DC_OPERATIONS, with a provenance backbone (FACT_FIELD_LINEAGE) that records the source, method, and researcher for every data point. Campus deduplication is enforced at the DIM_CAMPUS layer.
Campus — Deduplication Root
Campus ID (public: DE-CAM-XXXXXXX), canonical name, lat/long centroid, AI Tier (1–4),
status, primary operator FK, speculation flag.
Dedup rule: operator (canonicalized) + ≤500m centroid + non-contradicting tenant.
Facility — Building Level
Facility ID (DE-FAC-XXXXXXX), Campus FK, address, coordinates, type (Hyperscale / Colocation / Enterprise / Edge), building count, facility sqft, commission year, facility-level tier, status.
Central Fact Table
One row per campus per reporting year. Capacity: power_capacity_mw, gpu_capacity_h100e, capex_billion_usd. Operations: power_usage_mwh, pue, wue, water_consumption_mgal. Confidence: confidence_score, power_method, water_method.
Provenance Backbone
Target table / key / field, source key, raw value, specific URL, ingestion date, method (direct_disclosure | permit_derived | modeled_from_size | state_avg_fallback | manual_research), confidence contribution, researcher, notes.
Operators & Tenants
Canonical name, aliases, entity type (Operator / Tenant / EnergySupplier / Investor / Constructor), ownership type, is_ai_pureplay flag, is_hyperscaler flag, ticker symbol, website.
Source Registry
Source ID (FRACTRACKER-2026-01 format), name, organization, URL, type, methodology URL, credibility tier (1–5), paywall flag, last verified date, fact sheet path.